Denoising gene expression by stCluster
In addition to clustering, the embeddings generated by stCluster can be applied to a variety of other downstream tasks. In this section, we will use gene expression denoising as an example to assess the expressive of the embeddings learned by stCluster.
[1]:
import scanpy as sc
from st_datasets.dataset import get_data, get_dlpfc_data
from stCluster.eval import eval

adata, n_cluster = get_data(dataset_func=get_dlpfc_data, id='151507')
adata, g = eval(adata, radius=150, model_paras_path='/home/hanshu/stCluster_paras/DLPFC/DLPFC_0.pkl')
>>> INFO: Download dataset: 100%|██████████| 98.8M/98.8M [00:05<00:00, 17.7MB/s]
>>> INFO: dataset name: dorsolateral prefrontal cortex (DLPFC), slice: 151507, size: (4226, 33538), cluster: 7.(6.991s)
>>> INFO: Input size torch.Size([4226, 3000]).
>>> INFO: Graph contains 28996 edges, average 6.861 edges per node.
>>> INFO: Build graph success!
>>> INFO: Finish load model, begin to generate embedding and rebuild gene expression, input data size: (4226, 3000).
>>> INFO: Finish embedding generation process, please use the embedding to do downstream evaluation, total time: 1.544s
To facilitate your assessment of the gene expression denoising effectiveness, stCluster incorporates a built-in denoising model that is used to train a denoised gene expression matrix through the embeddings.
[2]:
import scanpy as sc
from stCluster.denoising import train
adata = train(data=adata, spatial_graph=g) # train denoised gene expression matrix
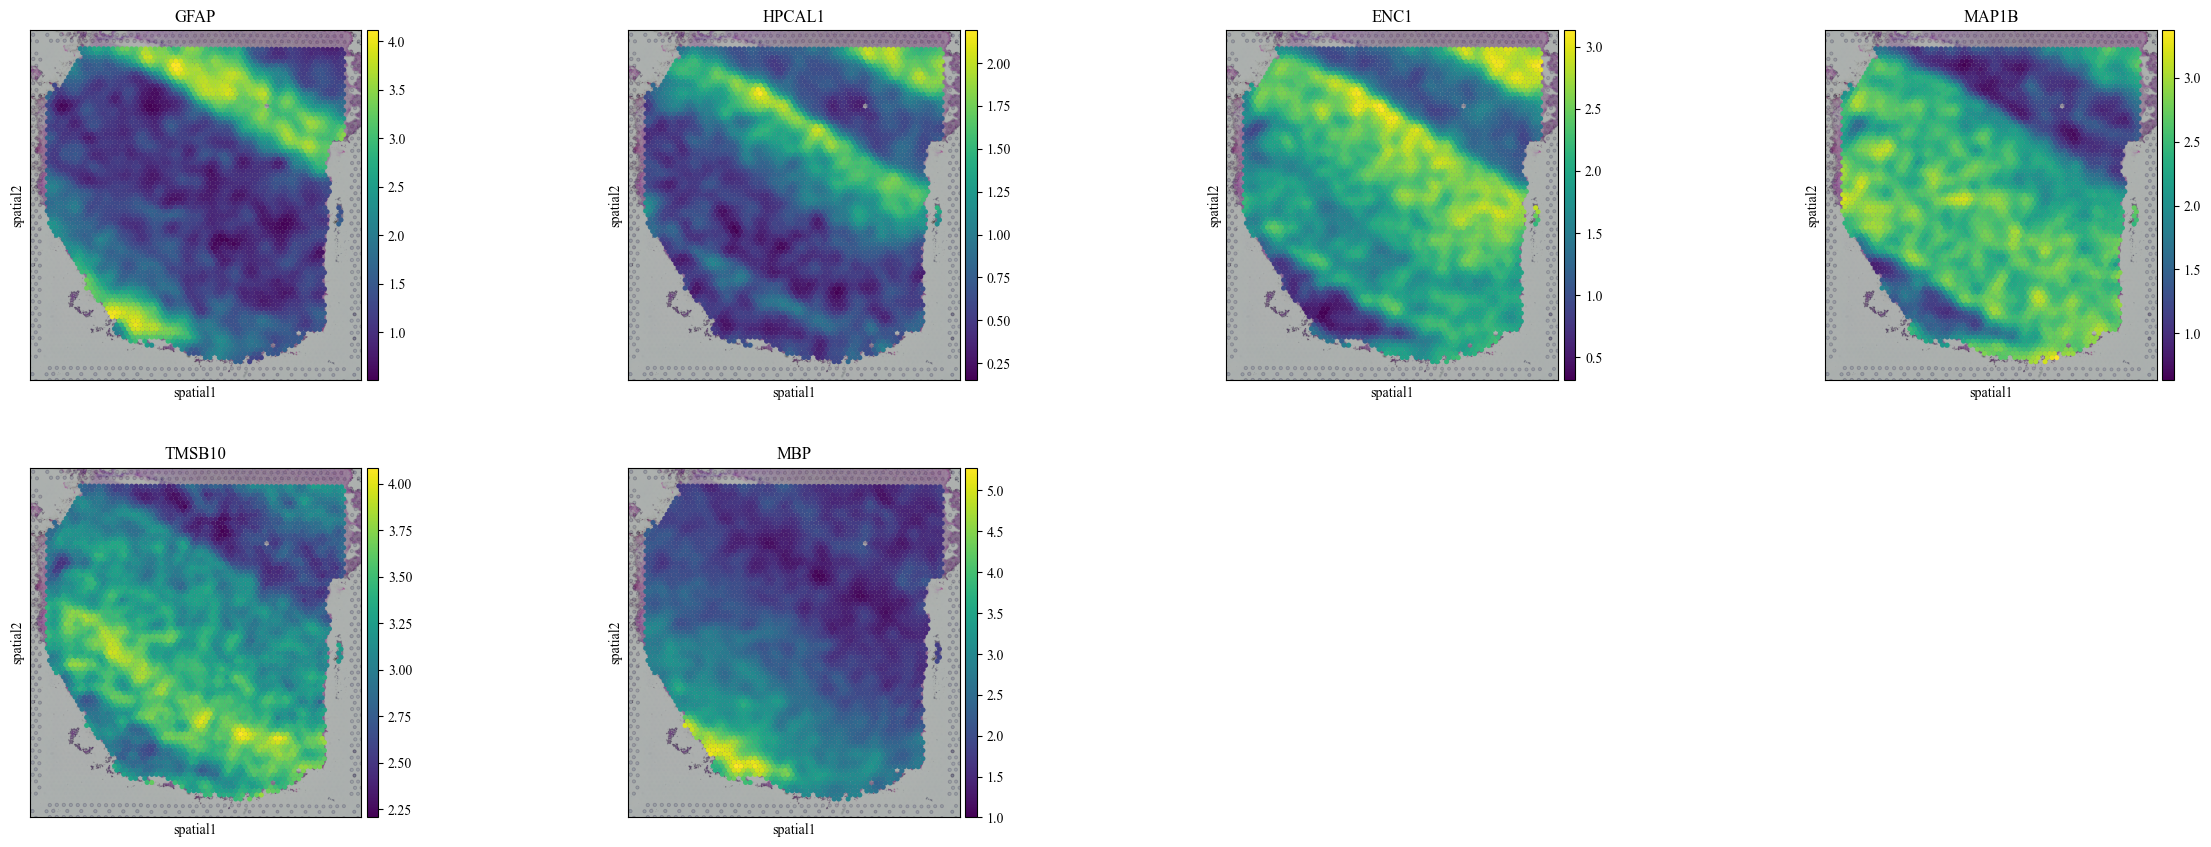
# draw plots
sc.pl.spatial(adata, color=['GFAP', 'HPCAL1', 'ENC1', 'MAP1B', 'TMSB10', 'MBP'], spot_size=150)
sc.pl.spatial(adata, color=['GFAP', 'HPCAL1', 'ENC1', 'MAP1B', 'TMSB10', 'MBP'], layer='denoised_gene', spot_size=150)
>>> INFO: Input size torch.Size([4226, 30]).
>>> INFO: Training: 100%|██████████| 600/600 [00:03<00:00, 187.93it/s]
>>> INFO: Finish gene denoising process, total time: 3.267s.